Marketing report template: structure that survives client review
A practical marketing report template — five sections that survive client review, which slides clients actually read, and when to upgrade to automation.
A marketing report template that survives client review has five sections in this order: an executive summary with a verdict, channel performance against targets, what worked and what didn’t with a hypothesis for each loss, audience and pipeline insight, and next month’s plan as commitments. The CMO reads three of the five; this piece says which, and when to stop building it by hand.
The first slide of a monthly marketing report is the only one some clients will read. Their CMO opens the deck on a phone between meetings, scrolls to the summary, and decides — in about ninety seconds — whether the retainer is delivering. Everything else in the deck exists to back up that page. Most marketing report templates I see have it the wrong way round: forty slides of channel detail and a summary built from whatever fit on one slide at the end.
The fix is structural. A working marketing report template has a spine that survives client review because each section answers a question someone in the room actually asked. This piece is the version I’d hand a new account director on day one — five sections, what each one is for, which slides get skimmed and which get read, and when to stop maintaining it by hand. For the broader operational view, the agency client reporting automation covers the surrounding system.
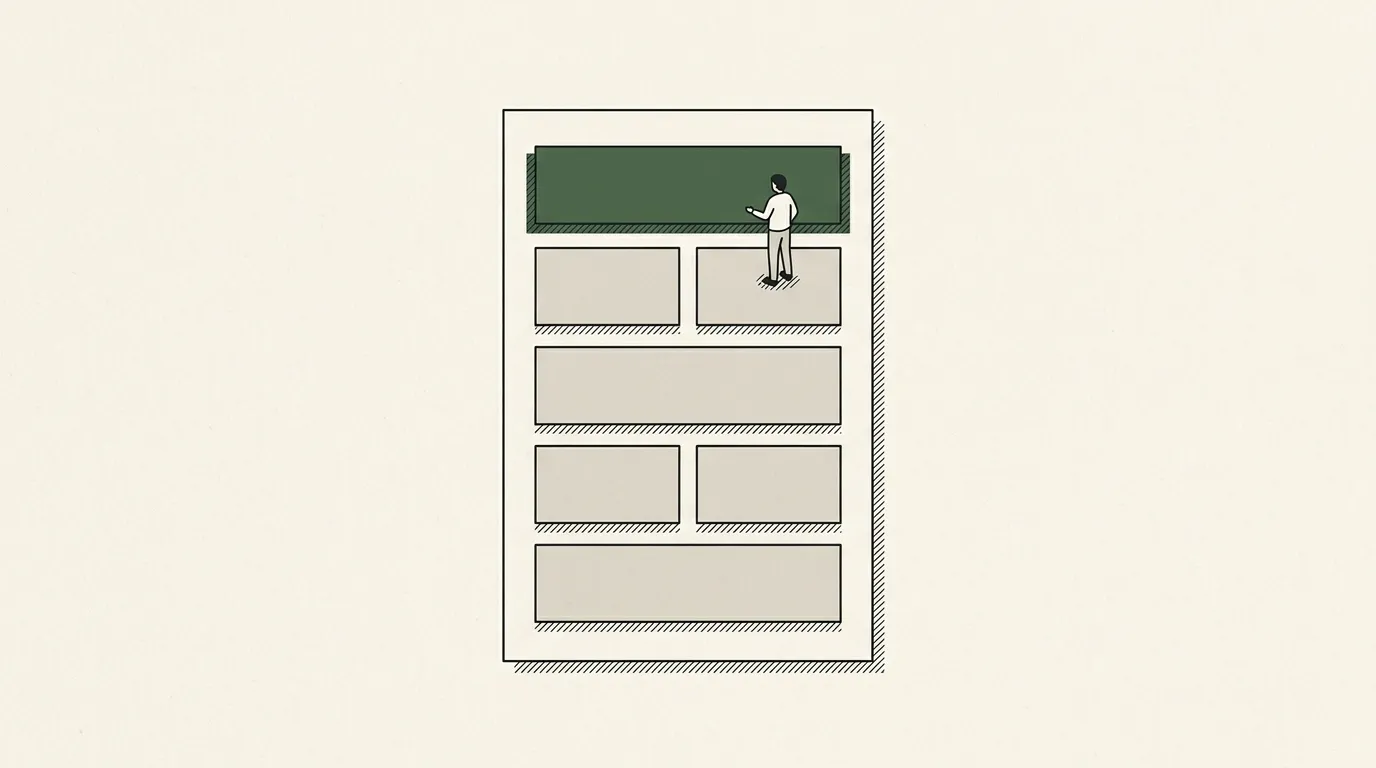
The five sections that earn their slide count
Every marketing report template I’ve seen survive a year of client reviews has the same five-section shape. The order matters. The proportions matter more.
| # | Section | Slides | Who reads it | Automatable |
|---|---|---|---|---|
| 1 | Executive summary | 1 | The CMO, on a phone, in ninety seconds | The numbers, not the sentence |
| 2 | Channel performance vs targets | 1 per channel | The marketing director, to defend the spend | Fully: spend, output, outcome, variance from connectors |
| 3 | What worked, what didn’t | 2 | The clients who renew | The numbers; the hypotheses are the strategist’s |
| 4 | Audience and pipeline insight | 1 | The analyst on the client side | No; this is what the retainer pays for |
| 5 | Next month’s plan | 1 | Everyone, next month, as a contract | No |
1. Executive summary — the slide everyone reads
One slide. Three to five lines of narrative, two to four headline metrics, a clear verdict on the month. Not a table of contents. Not a recap of what was promised. The summary tells the reader: did we win, did we hold, or did we miss — and what’s the one thing we’re doing about it.
The mistake most templates make is building the summary as a dashboard tile grid. Six metrics with green and red arrows and no narrative. The CMO doesn’t want six numbers; they want one sentence and the proof. Write the sentence first. Pick the numbers that defend it. The rest of the deck is the appendix to that page.
Two structural rules that pay off: lead with the verdict, not the metric. “October beat target on pipeline despite a soft top-of-funnel” is a sentence the CMO can repeat to the CEO. “MQLs were 2,341 vs 2,500 target” is a number they have to interpret.
2. Channel performance vs targets
This is where the channel teams live. Paid social, paid search, organic, email, content, partnerships — whichever channels are in scope. Each channel gets one slide or one row, depending on the format, with the same shape every month: spend, output (impressions, sessions, leads), outcome (pipeline, opps, revenue, whatever the contract names), and variance against target.
The discipline here is variance, not volume. A slide that says “we ran 14 campaigns and generated 1.2M impressions” is useless without a target line. Was 1.2M the goal, double it, half it? The number means nothing without context. The slides that survive client review have a target column that lets the reader read variance at a glance.
The other rule: same shape every month. If the November report and the October report use different metrics, the client can’t compare. They will. They will have last month’s deck open next to this one. The variance is the point.
3. What worked, what didn’t
The honest section. Two columns or two slides — the wins and the losses. This is the section the account director will agonise over because they’re being asked to write down, in a document the client keeps, what didn’t work this month.
Do it anyway. The clients who matter — the ones who renew — read this section first. They want to know that the agency knows. A retainer that only ever ships wins is a retainer the client stops trusting. A retainer that ships honest losses with hypotheses for next month is a retainer that grows.
The structural rule: each loss gets a hypothesis. “LinkedIn CPL was 40% over target” isn’t enough. “LinkedIn CPL was 40% over target — we suspect audience saturation in the core ICP segment, testing a new lookalike layer in November” is an answer. Hypothesis-free losses make the agency look like it’s reporting weather.
4. Audience and pipeline insight
The narrative slide. Where the report stops being a scorecard and starts being a perspective. What did the data tell us about the audience this month? Which segments moved, which channels are converting, where is the pipeline coming from that wasn’t obvious last quarter?
This section is the one that earns the next twelve months of retainer. A channel report any platform can produce. An audience insight requires someone to have looked at the data and thought about it. The CMO reads this slide for the same reason they hired the agency in the first place — for the thinking, not the running of the campaigns.
Most templates skip this section because it can’t be auto-generated from a connector. That’s exactly why the templates that include it stand out. Don’t try to template the conclusion. Template the slide and let the strategist write the paragraph.
5. Next month’s plan
The closing slide. Three to five concrete things the team will do in the next cycle. Not a wish list. Not a quarterly plan rewritten as a monthly. The specific moves: which campaigns we’re testing, which experiments we’re shipping, which numbers we’re tracking against next month.
This is the slide that gets quoted back to you. Treat it like a contract. If you commit to a LinkedIn lookalike test in November’s report, the December report is going to need a row that reports on it. The plan section is what makes the next report’s “what worked / what didn’t” section legible.
The narrative slide that makes execs read the deck
The structural pattern that separates the marketing report templates that get read from the ones that get filed: the narrative slide.
It sits between the executive summary and the channel detail. Sometimes it’s a single chart with a story; sometimes it’s a quote from a customer; sometimes it’s a pipeline graph with three callouts and a paragraph of context. The format is less important than the function. The narrative slide is the agency saying: here is what this month means.
Without it, the deck is a dashboard with chrome. The CMO sees numbers and goes back to their inbox. With it, the deck is a perspective — and the CMO forwards a screenshot of that slide to the CEO.
The narrative slide is also the part of the template that resists automation hardest. Channel performance is a connector and a chart. The narrative is a person looking at the data and writing a sentence. The right system uses automation to free up the strategist’s time so they can spend it on this slide, not save them from writing it.
For a deeper structural treatment that covers the report cadence and approval flow, see monthly client report template. For the social-channel-specific cuts, social media report template walks the LinkedIn, Meta and TikTok-specific structures.
Which sections clients skim and which they actually read
Worth being honest about, because it changes how you spend production time.
| Reader | Reads carefully | Opens only if surprised |
|---|---|---|
| CMO and C-suite | Executive summary, the narrative slide, next month’s plan: three slides of fifteen | Channel detail, to verify a number |
| Marketing director, head of growth | Channel vs targets, in detail; the numbers they quote internally | The rest |
| Performance manager, analyst | What worked / what didn’t, audience insight; hypotheses to test on their side | The summary |
Build the template knowing each of those audiences exists. The summary has to be skimmable for the CMO. The channel section has to be defendable for the marketing director. The insight section has to be substantive for the analyst. Same deck, three readers, three layers of depth.
Where the manual template stops scaling
For agencies under ten retainers, a hand-built marketing report template in Slides or PowerPoint is fine. The account director rebuilds it monthly, the strategist writes the narrative, the deck ships on the first Monday of the month. The cost is real but proportional.
Past ten retainers, the maths shifts. Same five-section template across fifteen clients means an account director rebuilding the same scaffold seventy-five times a quarter — pulling the same metrics from the same connectors, writing the same channel slides, producing the same shape. The strategic work — the narrative, the insight, the next-month plan — is buried under the structural work of producing the deck at all.
This is the breakeven point most agencies hit between the second and third year. The template is good. The structure is right. The labour of producing it cycle after cycle becomes the constraint on growing the book. The agencies that grow past this are the ones that turn the template into a generation pipeline — same five-section spine, fed from the connectors directly, with the strategist writing the narrative slide and the platform doing everything else.
What stays in the template, what doesn’t
The marketing report template stays. The five sections, the slide order, the section proportions — that’s the spine. It survives the move from manual to automated because the structure is right whether a person or a pipeline produces it.
What changes is the labour. The connectors fill the channel slides. The variance columns calculate themselves against the target inputs. The brand layer — colours, logos, typography — sits in the master template and gets applied per client. The strategist is freed from rebuilding the scaffold and writes the narrative and the next-month plan, which is where their time should have been all along.
The output looks the same to the client. That’s the point. The whole exercise of templating a marketing report is to make the artefact consistent — month over month, client over client — and the client never has to think about how it was made.
For the full operational picture, including approval flow, white-labelling and how this fits into the broader agency reporting stack, see the agency client reporting automation. For a sibling cut focused on the monthly cadence specifically, monthly client report template covers the production calendar around this template.