Monthly client report template (Google Slides + Airtable structure)
A free monthly client report template — four sections that hold up across clients, the Airtable schema that backs it, and when to upgrade to automation.
A monthly client report template has four sections: outcomes against targets, what we did, what we learned, and what’s next, with dates. It has to renew the retainer, hold the same shape across every client, and white-label to each client’s brand. This piece sets the sections and the five-table Airtable schema that fills them one client at a time.
The agency had eleven clients on monthly retainers, and the first Monday of every month belonged to the same person. She’d spend the morning pulling numbers from each client’s ad accounts, the afternoon copy-pasting them into eleven slightly-different decks, and the evening writing eleven slightly-different “what’s next” paragraphs. By Friday the reports went out. By the following Monday she’d start over. The reports themselves were good. The cost of producing them was the cost of one full-time person, which is not what the retainer was priced against.
That cycle is the case for a real monthly client report template — not a generic agency deck, but a structure that holds across clients, white-labels cleanly, and can be filled by a database instead of by hand. This piece is that template. Four sections. The Airtable schema that backs it. And the honest line where a free template stops being enough and the agency needs the agency client reporting automation pipeline approach.

What the monthly client report template has to do
Three jobs, in order.
It has to renew the retainer. The artefact is what the client points to when their CFO asks why they’re spending what they’re spending. Outcomes against targets, in the language the contract was sold in. If the report doesn’t make that case, the renewal conversation gets harder.
It has to hold across clients. The agency runs eight, fifteen, fifty clients in parallel. The template has to be the same shape for each one, because the team’s review process — the QC pass, the strategist’s edit, the account manager’s sign-off — depends on the shape being consistent. Per-client snowflake decks scale linearly with headcount.
It has to white-label cleanly. The client’s logo, primary colour, typography. Not the agency’s. The brand the client sees on the artefact is their own.
The four-section structure below is the shape that survives those three jobs at agency scale.
| # | Section | The question it answers | One rule |
|---|---|---|---|
| 1 | Outcomes vs targets | Did we deliver what the retainer was sold on? | Targets, actuals, delta, one sentence at the top; bad numbers on slide one, not slide eleven |
| 2 | What we did | What did the money buy this month? | Only the three things per category that ladder up to the outcomes, with screenshots of the real artefacts |
| 3 | What we learned | What changes next month’s plan? | Two or three genuine insights; activity without interpretation is a freelancer’s report |
| 4 | What’s next | What are you committing to? | Dated, specific, with an expected result; the renewal conversation in one slide |
The four sections
1. Outcomes vs targets
The first content slide. Three or four outcomes the client cared about when they signed — leads, MQLs, revenue attributed, content shipped, hours of attention, whatever the contract was scoped against. Targets in one column, actuals in another, delta in the third. A clean bar chart. One sentence at the top: “[Client] hit three of four targets this month, with a meaningful gap on [metric].” The sentence is the artefact.
The discipline on this slide is to keep it short and to keep the numbers honest. Agencies that bury bad numbers on slide eleven get fired on slide eleven. Agencies that surface bad numbers on slide one with a credible “here’s what we’re doing about it” narrative get retained.
2. What we did
The work slide. The two-to-five categories of activity the agency owns for this client — paid acquisition, content production, lifecycle, social, brand. Per category: what shipped, what was tested, what changed since last month.
The trap is dumping every line of work into a list. Resist. Pick the three things per category that map to the outcomes above. If the outcome was “leads,” the work slide says what was done to drive leads. If the outcome was “content velocity,” the work slide says what was published. Work that doesn’t ladder up to the outcomes is noise — and noise is what clients remember as the reason they’re paying for “lots of stuff” instead of for a clear result.
Two visuals: a small grid showing the categories and the headline activity in each, and a screenshot or two of the actual artefacts (the ad creative, the page that launched, the email that sent). The screenshots matter — clients read images faster than they read bullet points, and the report should reward fast reading.
3. What we learned
The thinking slide. Two or three insights the team pulled out of this month’s data that change the next month’s plan. A creative test that beat control by a meaningful margin. A channel that surprised on the upside. An audience segment that didn’t perform.
This is the slide that distinguishes an agency from a freelancer. A freelancer reports activity. An agency reports activity plus interpretation. If the team has nothing genuine to put on this slide, the issue isn’t the template — the team isn’t analysing the work, they’re just doing it.
4. What’s next
The forward slide. The two or three things the team is doing next month, why, and what they expect from each. With dates.
The discipline here is to write commitments, not aspirations. “We’ll test three new audiences in the paid acquisition account against the current control, with a target of beating CPM by 10%, decision by mid-month.” Not “we’ll continue to optimise paid acquisition.” The first sentence is the renewal conversation. The second is the reason the client thinks they could do this themselves.
The Airtable schema behind it
The free template is a Slides file the team copy-pastes into. The upgrade is the data model that fills it. Five tables.
| Table | One row per | Fields |
|---|---|---|
| Clients | Client | Name, brand colour, logo URL, brand font, account manager, retainer tier, contract start, renewal date, primary contact |
| Channels | Channel per client | Client (link), channel, monthly budget, current benchmark |
| Outcomes | Outcome per client per month | Client (link), month, outcome name, target, actual, delta, narrative, status |
| Activities | Activity per client per month | Client (link), month, channel (link), name, description, screenshot URL, result narrative |
| Insights | Insight per client per month | Client (link), month, insight, evidence, implication, status (validated / hypothesis) |
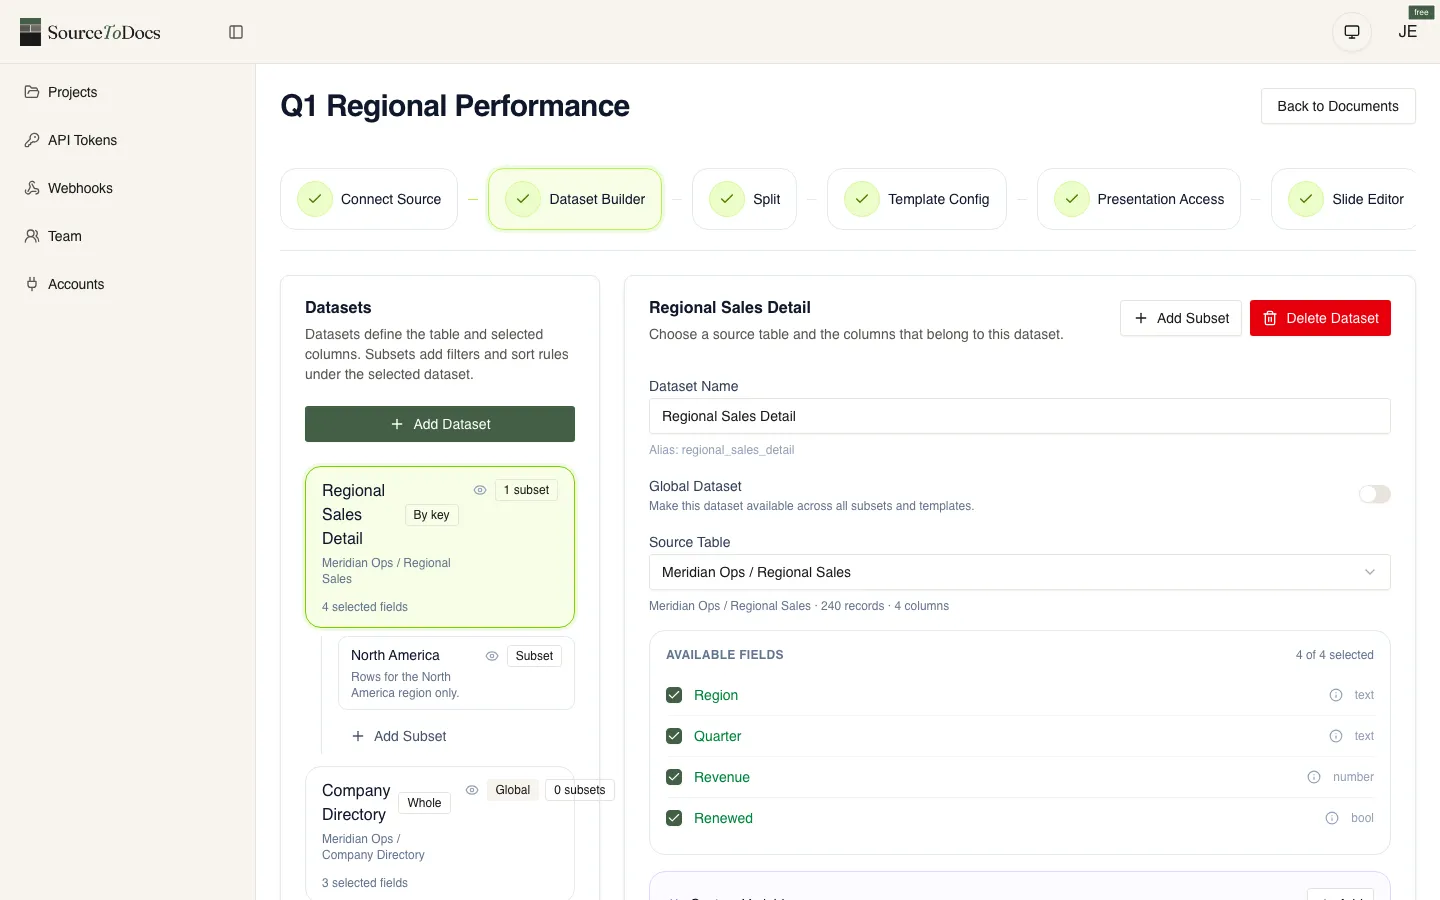
The Slides template binds to this schema one section at a time. Outcomes slide pulls from Outcomes. What-we-did slide pulls from Activities, grouped by Channel. What-we-learned slide pulls from Insights. What’s-next slide pulls from a Plans table or from the next-month rows of Activities, depending on how the agency models forward planning.
The brand fields on the Clients table — colour, logo, font — feed the white-labelling layer. Each generation pulls the brand for that client and renders the deck against it. One template, eleven brands, eleven decks per cycle.
For the build itself, see Airtable to Google Slides: the base schema, the field map and the four things that break it.
What this template gets right that generic ones don’t
A few things, worth naming explicitly.
It puts outcomes on slide one. Not on slide nine. The client’s CFO doesn’t read past slide three; the report is designed against that constraint.
It separates “what we did” from “what we learned.” Most agency templates conflate them, which leaves the report reading as activity reporting with no interpretation. Splitting the two slides forces the team to write down their thinking, which is what clients are actually paying for.
It commits on the last slide. “What’s next” is dated and specific. The renewal-supporting artefact is the one that says what the team will do, not the one that says what the team did.
It assumes the data lives somewhere queryable. The schema isn’t optional — at five clients you can run the template manually, but the moment the agency hits ten clients, the database is the difference between scaling and burning out the account team.
When to upgrade
Three signals. The agency has more than ten clients on the same monthly cadence. More than 90% of report content comes from queryable data sources. Account managers spend more than two hours per client per month on report production.
Hit two of three and the manual template stops paying. The next step is a pipeline — the Airtable schema feeding the Slides template feeding the white-labelled per-client output, on the first Monday of every month, without an account manager in the loop. The architectural shape lives in the agency client reporting automation, and the Airtable-side patterns live in the Airtable document automation.
For the channel-specific cousins of this template, see marketing report template and social media report template. For the longer architectural treatment of the automation, return to the agency client reporting automation.