Report automation tools: a buyer's framework for 2026
A buyer's framework for choosing report automation tools — three categories, five decision criteria, and a cost-per-cycle model that beats demo theatre.
Report automation tools form three markets, not one: dashboard tools (Looker, Tableau, Power BI), agency document tools (Whatagraph, AgencyAnalytics) and template platforms (SourceToDocs) that fill a designer-owned Slides or Docs master from data. Pick the category first, then score candidates on integrations, output format, template ownership, pricing and support, and run the cost-per-cycle arithmetic before any demo.
A finance ops lead I spoke to recently had a spreadsheet titled “tools we evaluated.” Twenty-three rows. Six categories. Four months of demos. They ended up buying one of the first three on the list — and the lesson wasn’t that the evaluation was wasted, it was that the framework wasn’t there from the start. They were comparing across categories that solved different problems.
That’s the failure mode this piece is built to fix. Report automation tools don’t form a single market. They form three — dashboard tools, document tools, and template platforms — and the right answer for any given buyer depends on which problem actually hurts. Pick the wrong category and the rest of the evaluation is theatre.
The longer architectural treatment lives on the report automation. This piece is the buyer’s framework: how to map the categories onto your situation, how to score the candidates, and how to do the cost arithmetic before someone’s signature is on a contract.
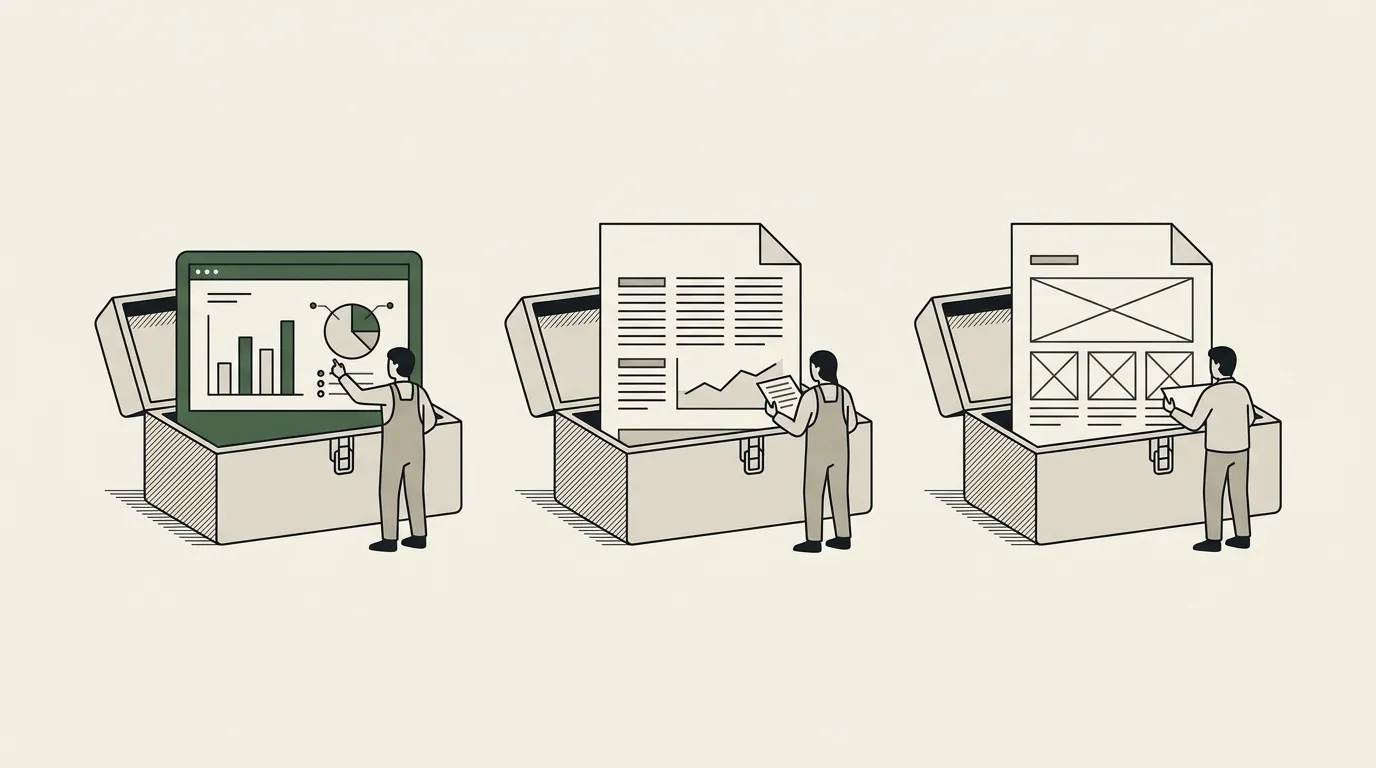
The three categories of report automation tools
Most procurement processes go wrong because they treat these three as substitutes. They aren’t. They sit in different parts of the data-to-audience pipeline.
| Dashboard tools | Document tools | Template platforms | |
|---|---|---|---|
| Examples | Looker, Tableau, Power BI, Domo, Mode | Whatagraph, AgencyAnalytics, ReportGarden, DashThis | SourceToDocs, Plus, Beautiful.ai |
| The artefact | A URL the audience visits | A templated PDF filled from marketing connectors | A designer’s own Slides or Docs master, filled with data |
| Shines when | The audience is internal, technical-adjacent, asking “what is happening now” | Your sources are the standard agency stack: Google Ads, Meta, GA4 | Brand fidelity matters and the report recurs |
| Struggles when | The audience is external, expects a designed PDF, or has no licence | The data is in a warehouse, the template is bespoke, white label must go deeper than a logo | The document is a one-off |
| Cost shape | Per seat | Per client | Upfront mapping, then a long flat tail |
The defensibility of the third category is brand fidelity: the output looks identical to the designed master, every run. For the architectural difference, see dashboard reports vs report automation.
Five decision criteria
Once you know which category you’re shopping in, the within-category evaluation comes down to five questions. Most demos answer the first one well and elide the rest. Force the rest.
| Criterion | The question | Dashboard tools | Document tools | Template platforms |
|---|---|---|---|---|
| Data integrations | Where does the source of truth actually live, and is it first-class or a workaround? | Own this dimension | Warehouse needs a Sheets or CSV intermediate | Varies; some API-first, some expect a workflow tool upstream |
| Output format | Live URL or static file; one format or several? | Live | Slides, Docs and PDF from one run | |
| Template ownership | Who owns the layout? | The tool’s design language, even themed | A constrained editor inside the platform | Yours, in your designer’s native tool |
| Pricing model | What does the vendor think the unit of value is? | Per seat | Per client: fine at five, brutal at fifty | Per workspace: feels expensive at five clients, flat at fifty |
| Support level | Who wires it up the first time? | Middle; paid services on top | Self-serve | Real implementation work up front |
Match the pricing curve to your trajectory, and be honest about who on your team has time to wire the tool up: the cheap-looking tool with no implementation support becomes the expensive one.
The cost-per-cycle math
The number that beats most vendor demos is one your finance team can run in five minutes.
Take the report you’re trying to automate. Estimate the analyst hours per cycle — be honest, include the email-chasing, the layout fixing, the QA pass, the last-minute change. Multiply by the loaded hourly rate (salary plus benefits plus overhead — usually 1.4x to 1.6x base). Multiply by cycles per year.
That’s your annual cost-of-manual. Compare against the annual subscription of each candidate, plus a one-time implementation estimate if there is one.
< 3×
saving vs subscription: do not buy. Tighten the manual workflow instead
3–5×
buy if the strategic upside is real: a freed analyst, no single-person risk, room for 2× volume
> 5×
procurement is a formality; the risk is deployment, not the purchase
Saving = analyst hours per cycle × loaded rate (1.4–1.6× base) × cycles per year, against subscription plus one-time implementation.
A few rules of thumb from teams I’ve seen run this honestly:
If the saving is less than 3x the subscription, don’t buy. The breakeven is too thin to absorb a single bad quarter or a process change. Tighten the manual workflow instead.
If the saving is 3x to 5x, buy if the strategic upside is real — freeing the analyst for higher-value work, removing single-person risk, enabling a 2x volume increase the manual process can’t support.
If the saving is more than 5x, the procurement is a formality. The risk shifts from “will this pay off” to “will we actually deploy it” — which is an implementation risk, not a buying risk.
The variable buyers underweight is volume growth. A pipeline that costs roughly the same to run at 10 reports a month and 100 reports a month changes the unit economics in a way the manual process never will. If your volume trajectory is steep, that delta is the real ROI, not the year-one saving.
Which category fits which buyer
A few patterns I see in the wild:
| Buyer | Start with | Graduate when |
|---|---|---|
| Finance team, internal ops reports, everyone has BI access | The dashboard tool you already pay for | The artefact has to leave the building |
| Agency, dozens of monthly client reports on a stable platform set | A document tool | White-label fidelity becomes a sales differentiator and dashboard-shaped output starts losing renewals |
| Consultancy, high-stakes branded deliverables | A template platform; the design quality is the product | — |
| Revenue ops running QBRs at scale | A template platform fed from the CRM and product analytics; shortlist in the client reporting tools comparison | — |
| Founder, monthly investor updates at small volume | A Google Doc and a saved structure | The cap table splits into audiences wanting different cuts |
When a tool isn’t the answer
One option the three categories leave out: not buying a tool at all. If the real bottleneck is upstream — the data lives in five systems that don’t talk to each other, or the report is one step in a process nobody owns — a tool only automates the last mile. In that case the higher-leverage fix is to have the whole workflow built and connected first, then layer reporting on top. That’s implementation work rather than a subscription, and it’s what an automation agency like 2V Automation does: map the process, connect the systems, and hand back something your team owns. Worth weighing build-and-own against buy-a-tool before committing to either.
How to actually pick
A 60-minute exercise that compresses most procurement timelines:
- 01
Pick one report
The painful one. Ask the four-component question of it: data layer, template, generation, orchestration. The pain is usually in the seam between template and data, which tells you that you are shopping for a generation engine, not a dashboard.
- 02
Pick the category that solves your seam
Then score three or four candidates within it against the five criteria above.
- 03
Run the cost-per-cycle math
Against each candidate, with honest hours and a loaded rate.
- 04
Book narrow demos
Your real data and your real template, not the vendor's marketing example.
The procurement processes that go well do this in two weeks. The ones that don’t go well are the twenty-three-row spreadsheets.
For the architectural background — what makes a report-automation system work, and where the failure modes are — read the report automation. The companion piece on the manual-to-automated transition is how to automate reports.
Common questions, answered
What's the difference between dashboard tools and report automation tools? +
Are AI deck generators report automation tools? +
How do I cost-justify a report automation tool internally? +
Should I build or buy? +
Which category fits an agency producing 50 client reports a month? +
Related reading
- Report Automation → Guide
- Document Automation → Guide
- Agency Client Reporting Automation → Guide
- How to automate reports: a practical guide for 2026 → Blog post
- Dashboard reports vs report automation: when to use which → Blog post
- 5 client reporting tools agencies use (and what each one misses) → Blog post